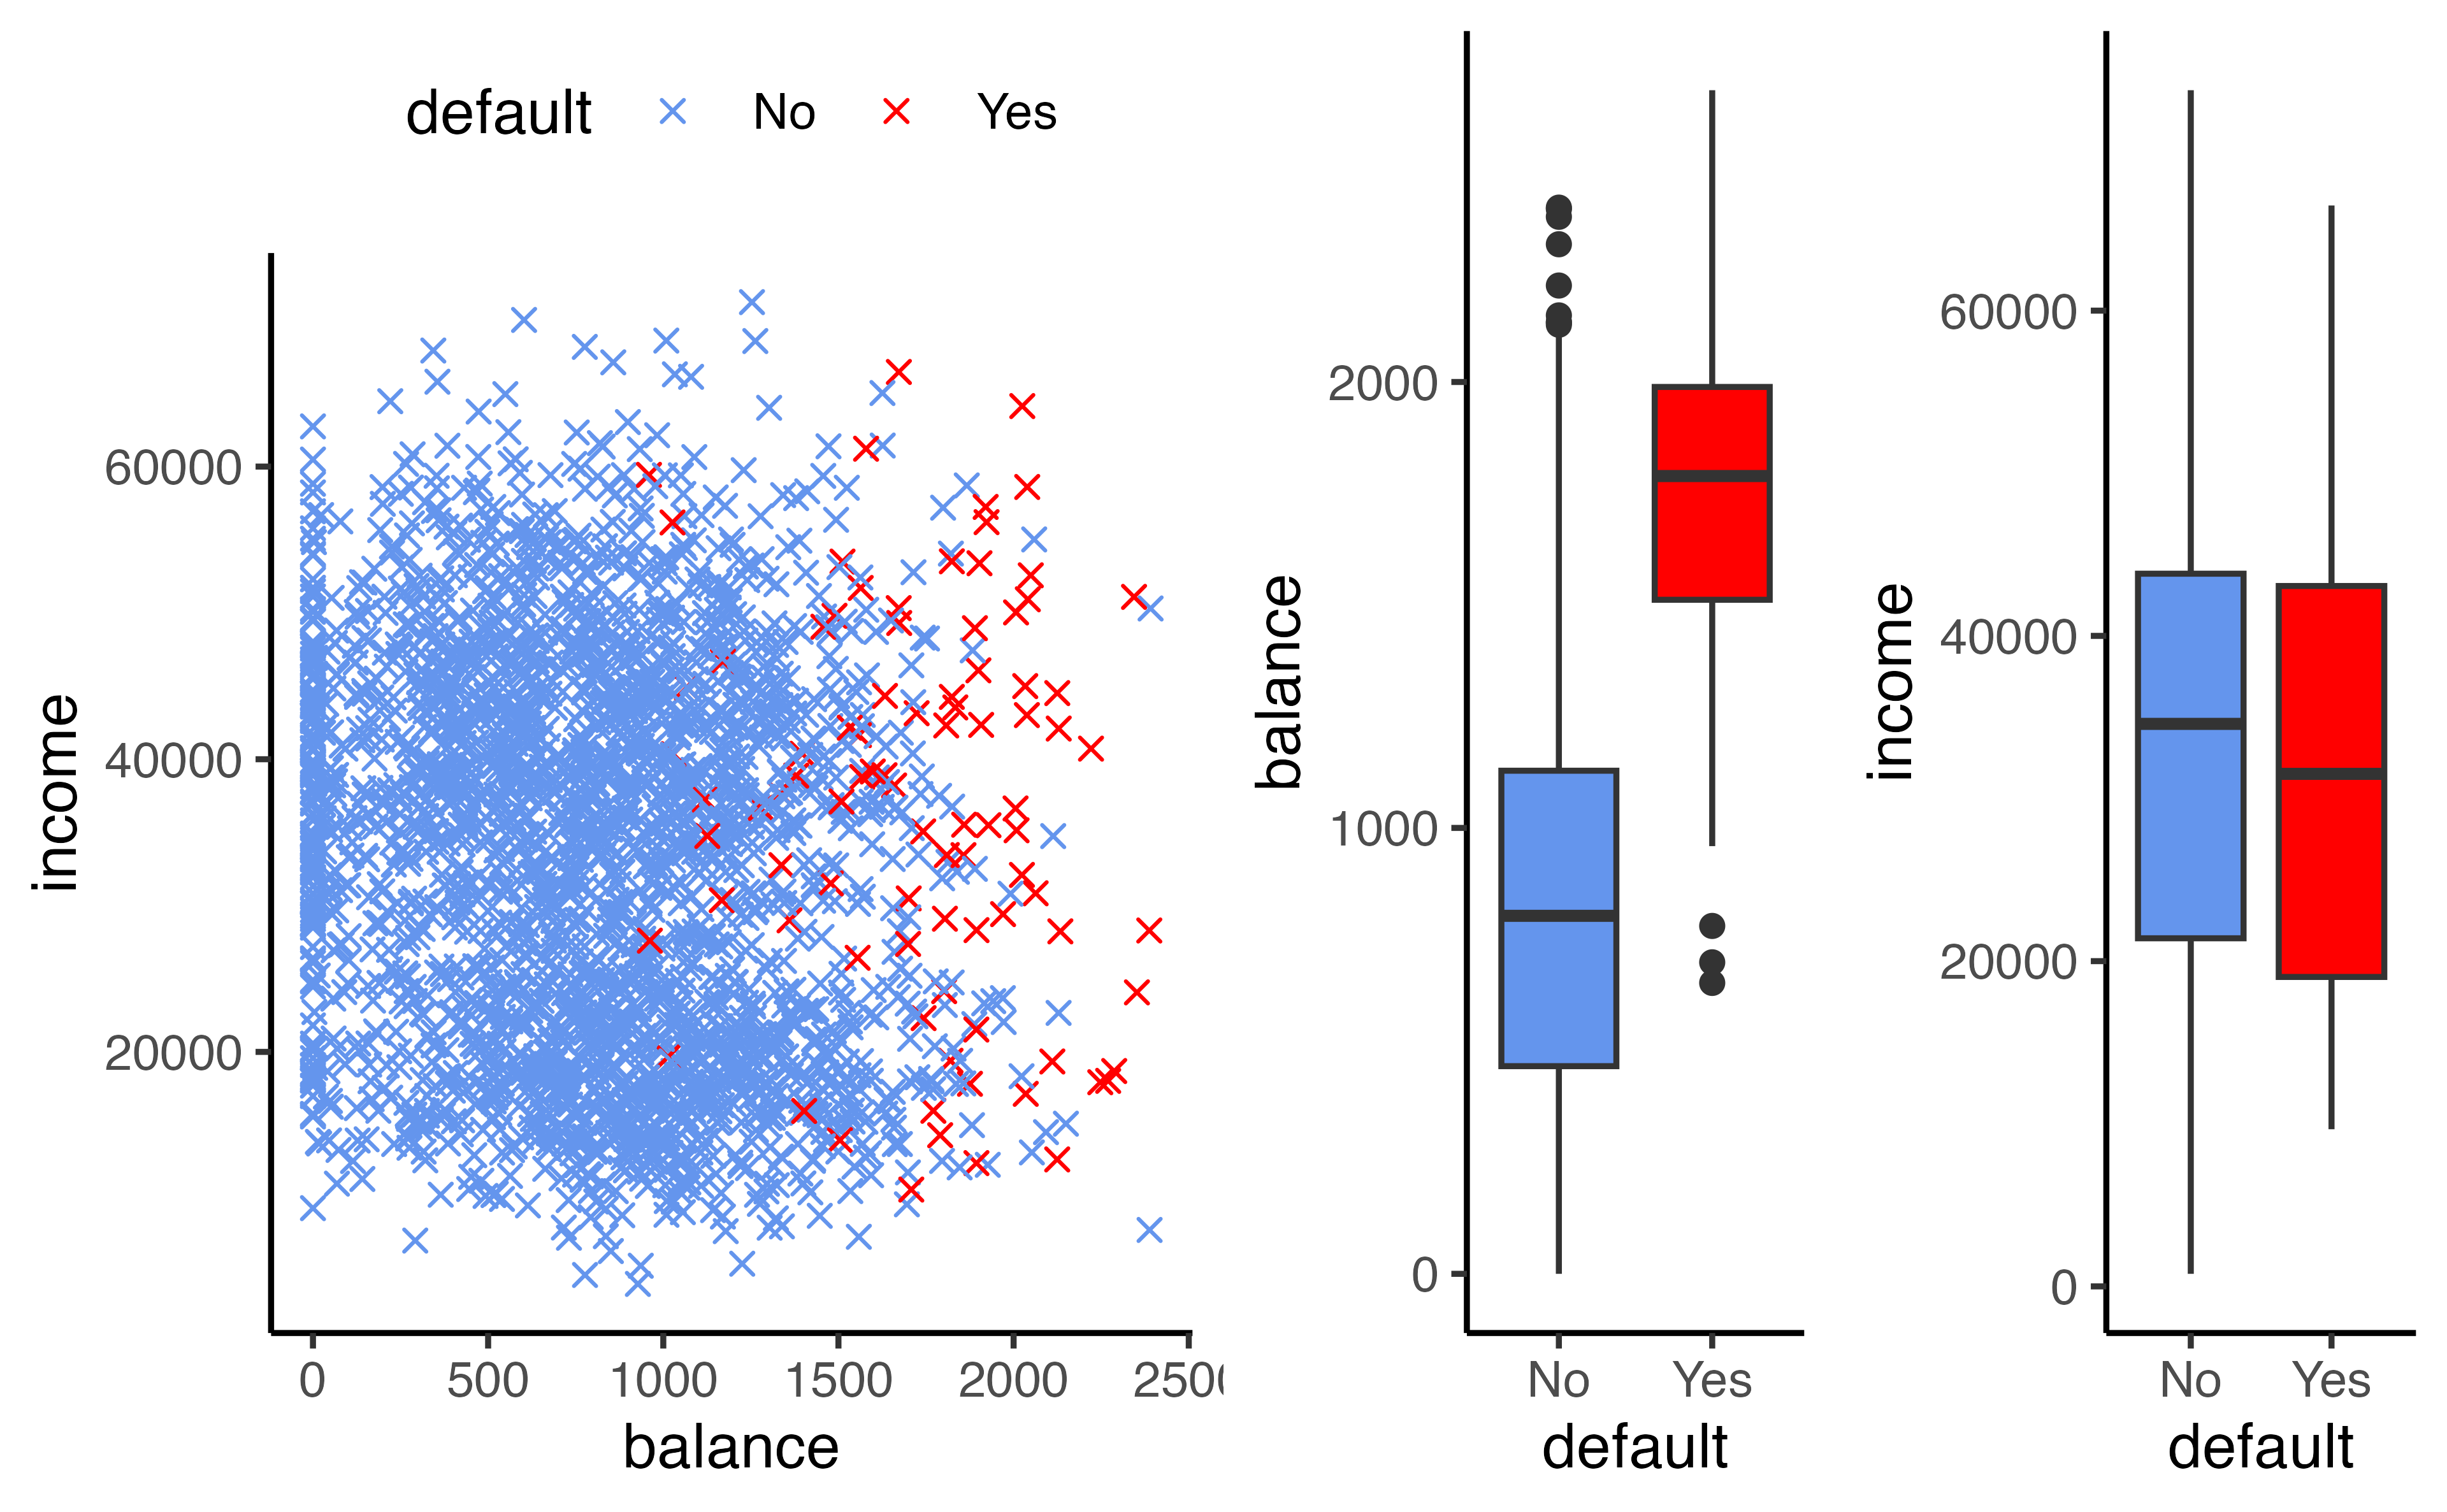
\[Y = \begin{cases} 0 & \textrm{if }\texttt{No}\\ 1&\textrm{if }\texttt{Yes}\end{cases}\] Can we fit a linear regression of \(Y\) on \(X\) and classify as Yes if \(\hat{Y}> 0.5\)?
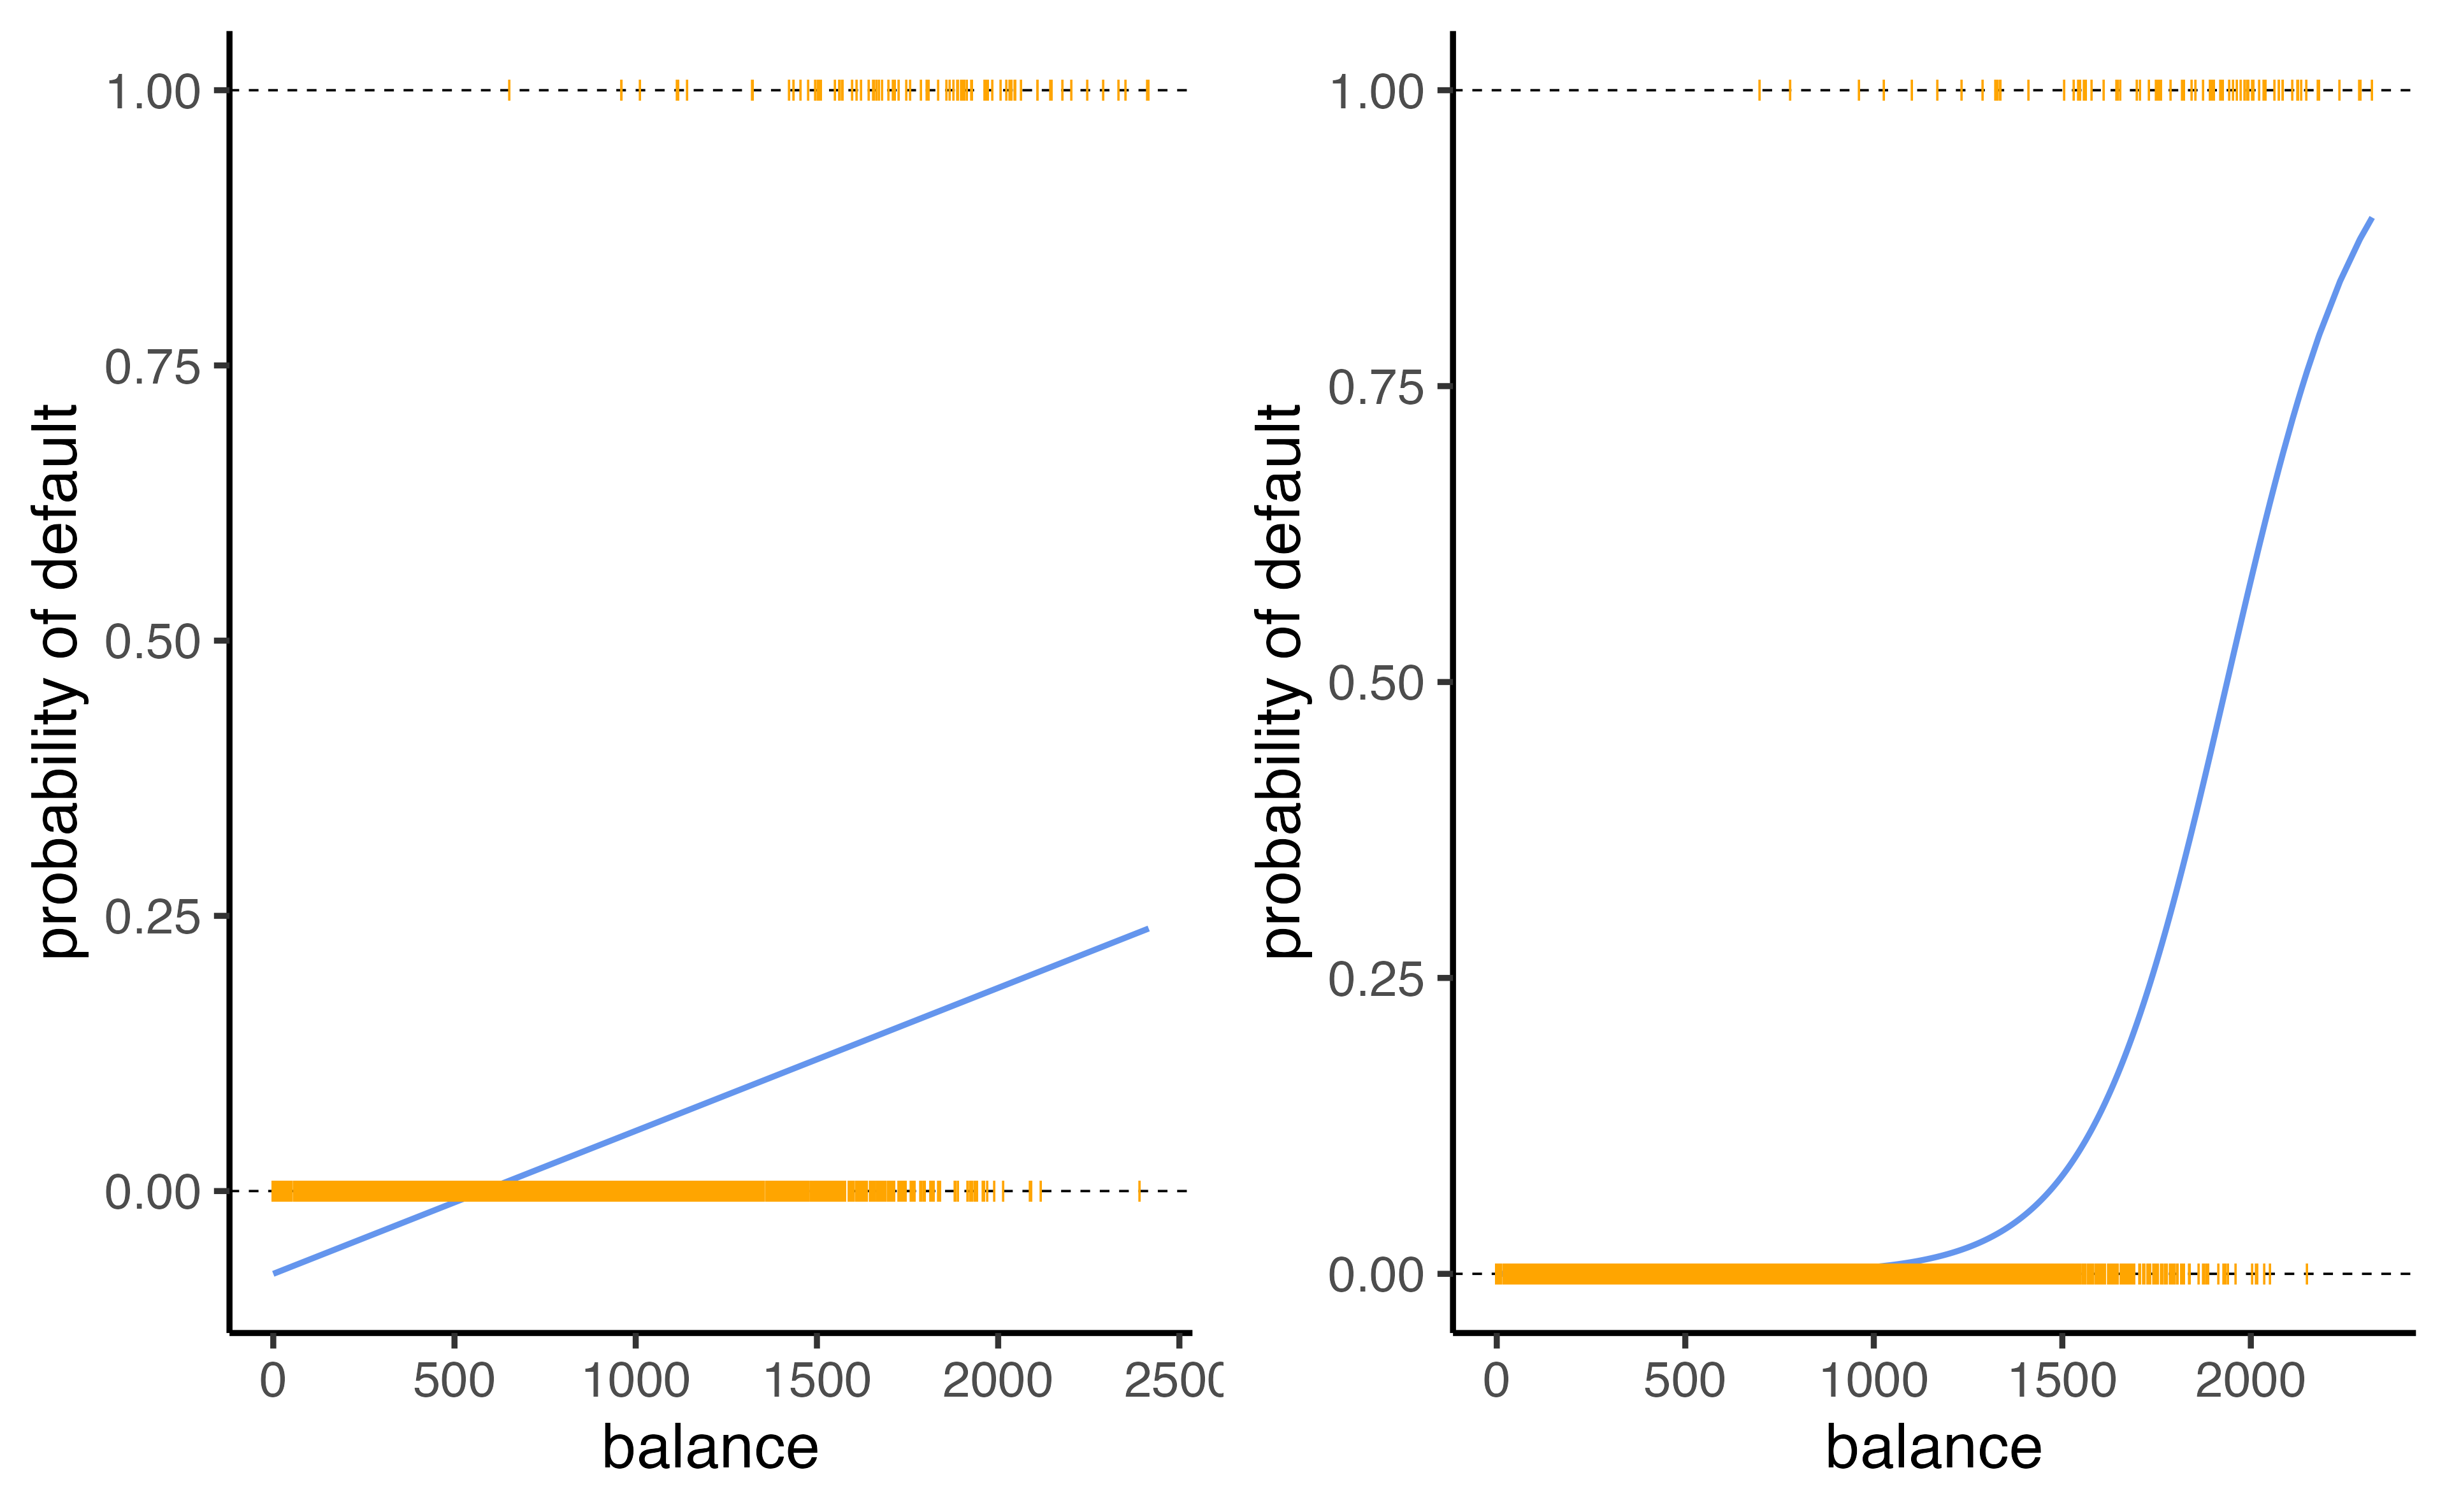
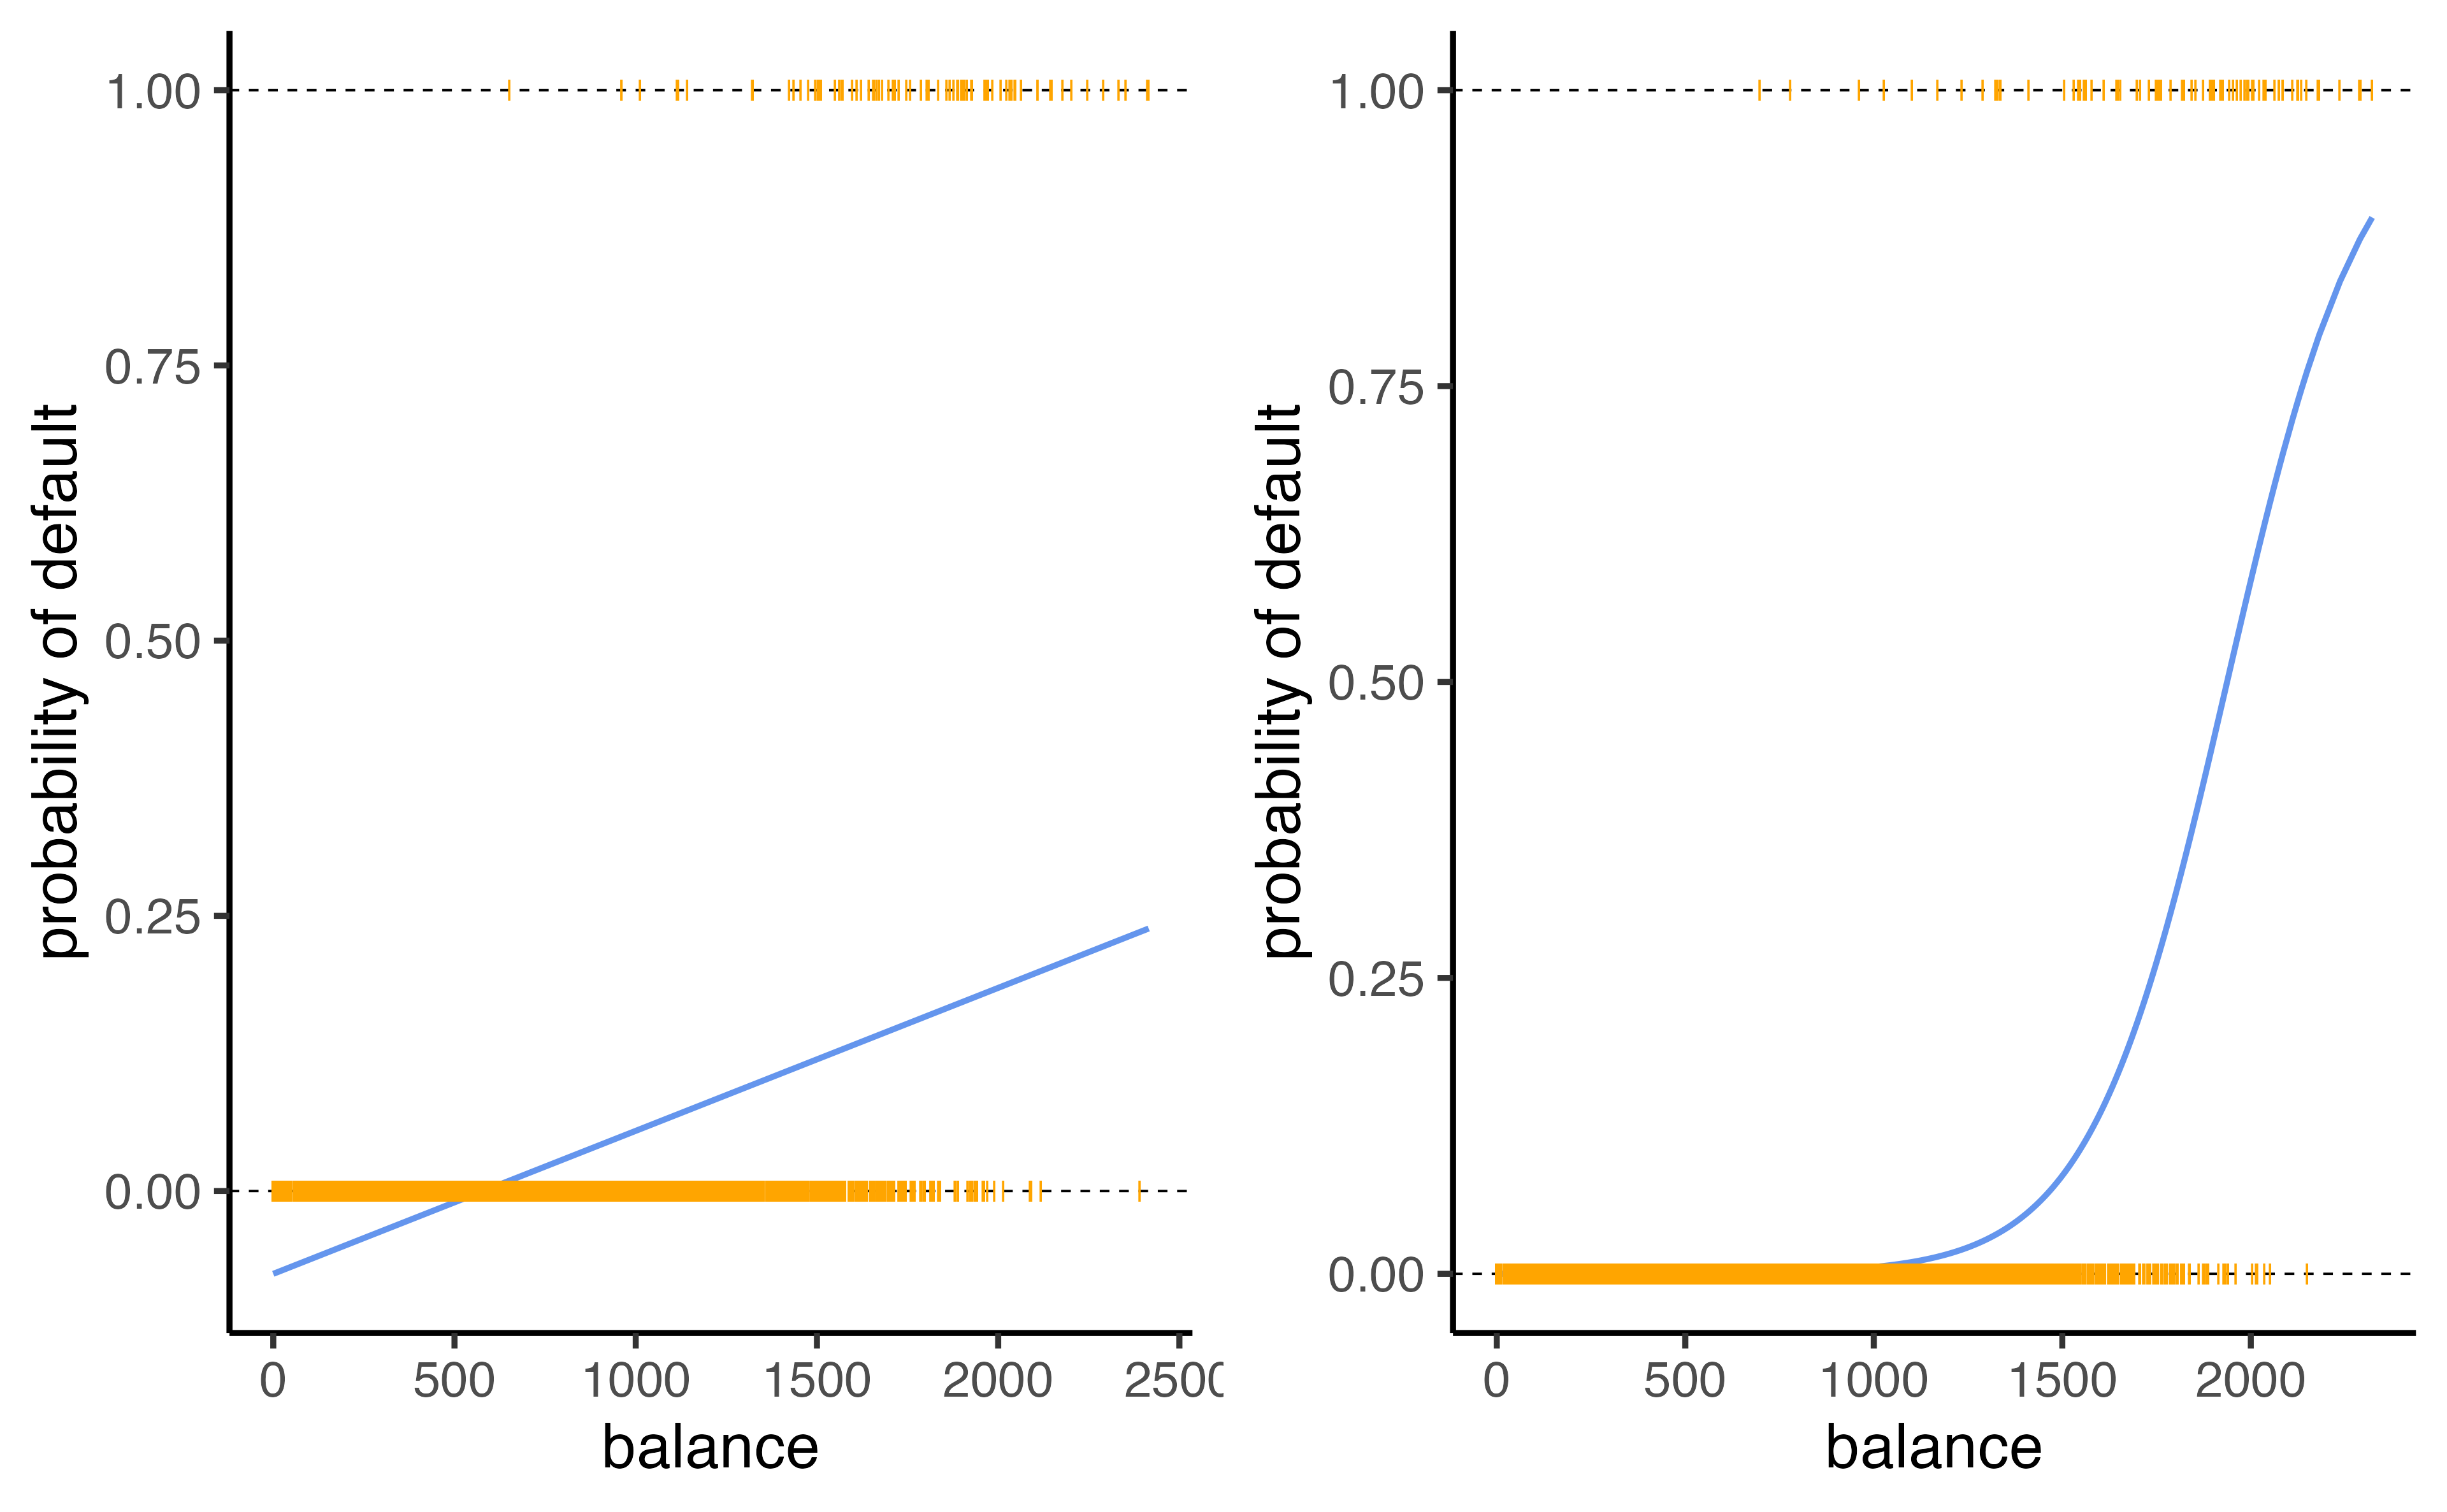
In this case of a binary outcome, linear regression is okay (it is equivalent to linear discriminant analysis, you can read more about that in your book!)
\(E[Y|X=x] = P(Y=1|X=x)\), so it seems like this is a pretty good idea!
The problem: Linear regression can produce probabilities less than 0 or greater than 1 😱
Can we use linear regression?
We can code Default as
\[Y = \begin{cases} 0 & \textrm{if }\texttt{No}\\ 1&\textrm{if }\texttt{Yes}\end{cases}\] Can we fit a linear regression of \(Y\) on \(X\) and classify as Yes if \(\hat{Y}> 0.5\)?
A study investigated whether a handheld device that sends a magnetic pulse into a person’s head might be an effective treatment for migraine headaches.
Researchers recruited 200 subjects who suffered from migraines
randomly assigned them to receive either the TMS (transcranial magnetic stimulation) treatment or a placebo treatment
Subjects were instructed to apply the device at the onset of migraine symptoms and then assess how they felt two hours later. (either Pain-free or Not pain-free)
Odds ratios
What is the explanatory variable?
A study investigated whether a handheld device that sends a magnetic pulse into a person’s head might be an effective treatment for migraine headaches.
Researchers recruited 200 subjects who suffered from migraines
randomly assigned them to receive either the TMS (transcranial magnetic stimulation) treatment or a placebo treatment
Subjects were instructed to apply the device at the onset of migraine symptoms and then assess how they felt two hours later (either Pain-free or Not pain-free)
Odds ratios
What type of variable is this?
A study investigated whether a handheld device that sends a magnetic pulse into a person’s head might be an effective treatment for migraine headaches.
Researchers recruited 200 subjects who suffered from migraines
randomly assigned them to receive either the TMS (transcranial magnetic stimulation) treatment or a placebo treatment
Subjects were instructed to apply the device at the onset of migraine symptoms and then assess how they felt two hours later (either Pain-free or Not pain-free)
Odds ratios
What is the outcome variable?
A study investigated whether a handheld device that sends a magnetic pulse into a person’s head might be an effective treatment for migraine headaches.
Researchers recruited 200 subjects who suffered from migraines
randomly assigned them to receive either the TMS (transcranial magnetic stimulation) treatment or a placebo treatment
Subjects were instructed to apply the device at the onset of migraine symptoms and then assess how they felt two hours later (either Pain-free or Not pain-free)
Odds ratios
What type of variable is this?
A study investigated whether a handheld device that sends a magnetic pulse into a person’s head might be an effective treatment for migraine headaches.
Researchers recruited 200 subjects who suffered from migraines
randomly assigned them to receive either the TMS (transcranial magnetic stimulation) treatment or a placebo treatment
Subjects were instructed to apply the device at the onset of migraine symptoms and then assess how they felt two hours later (either Pain-free or Not pain-free)
Odds ratios
TMS
Placebo
Total
Pain-free two hours later
39
22
61
Not pain-free two hours later
61
78
139
Total
100
100
200
We can compare the results using odds
What are the odds of being pain-free for the placebo group?
\((22/100)/(78/100) = 22/78 = 0.282\)
What are the odds of being pain-free for the treatment group?
\(39/61 = 0.639\)
Comparing the odds what can we conclude?
TMS increases the likelihood of success
Odds ratios
TMS
Placebo
Total
Pain-free two hours later
39
22
61
Not pain-free two hours later
61
78
139
Total
100
100
200
We can summarize this relationship with an odds ratio: the ratio of the two odds
\(\Large OR = \frac{39/61}{22/78} = \frac{0.639}{0.282} = 2.27\)
“the odds of being pain free were 2.27 times higher with TMS than with the placebo”
Odds ratios
What if we wanted to calculate this in terms of Not pain-free (with pain-free) as the referent?
TMS
Placebo
Total
Pain-free two hours later
39
22
61
Not pain-free two hours later
61
78
139
Total
100
100
200
\(\Large OR = \frac{61/39}{78/22} = \frac{1.564}{3.545} = 0.441\)
the odds for still being in pain for the TMS group are 0.441 times the odds of being in pain for the placebo group
Odds ratios
What changed here?
TMS
Placebo
Total
Pain-free two hours later
39
22
61
Not pain-free two hours later
61
78
139
Total
100
100
200
\(\Large OR = \frac{78/22}{61/39} = \frac{3.545}{1.564} = 2.27\)
the odds for still being in pain for the placebo group are 2.27 times the odds of being in pain for the TMS group
Odds ratios
In general, it’s more natural to interpret odds ratios > 1, you can flip the referent to do so
TMS
Placebo
Total
Pain-free two hours later
39
22
61
Not pain-free two hours later
61
78
139
Total
100
100
200
\(\Large OR = \frac{78/22}{61/39} = \frac{3.545}{1.564} = 2.27\)
the odds for still being in pain for the placebo group are 2.27 times the odds of being in pain for the TMS group
Application Exercise
5000 women were enrolled in a study and were randomly assigned to receive either letrozole or a placebo. The primary response variable of interest was disease-free survival.
letrozole
placebo
total
death or disease
185
341
526
no death or disease
2390
2241
4631
total
2575
2582
5157
Calculate the odds ratio of death or disease in the placebo group versus the treatment group
Calculate the odds ratio of no death or disease in the treatment group versus the placebo group
Calculate the odds ratio of death or disease in the treatment group versus the placebo group
04:00
Odds ratios
Let’s look at some Titanic data. We are interested in whether the passenger reported being female is related to whether they survived.
Female
Male
Total
Survived
308
142
450
Died
154
709
863
Total
462
851
1313
Odds ratios
What are the odds of surviving for females versus males?
Female
Male
Total
Survived
308
142
450
Died
154
709
863
Total
462
851
1313
\[\Large OR = \frac{308/154}{142/709} = \frac{2}{0.2} = 9.99\]
Odds ratios
How do you interpret this?
Female
Male
Total
Survived
308
142
450
Died
154
709
863
Total
462
851
1313
\[\Large OR = \frac{308/154}{142/709} = \frac{2}{0.2} = 9.99\]the odds of surviving for the female passengers was 9.99 times the odds of surviving for the male passengers
Odds ratios
What if we wanted to fit a model? What would the equation be?
Female
Male
Total
Survived
308
142
450
Died
154
709
863
Total
462
851
1313
\[\Large \log(\textrm{odds of survival}) = \beta_0 + \beta_1 \textrm{Female}\]
Odds ratios
\[\Large \log(\textrm{odds of survival}) = \beta_0 + \beta_1 \textrm{Female}\]
logistic_reg() |>set_engine("glm") |>fit(Survived ~ Sex, data = Titanic) |>tidy()
A one-tenth unit increase in GPA yields a 1.73-fold increase in the odds of acceptance
Application Exercise
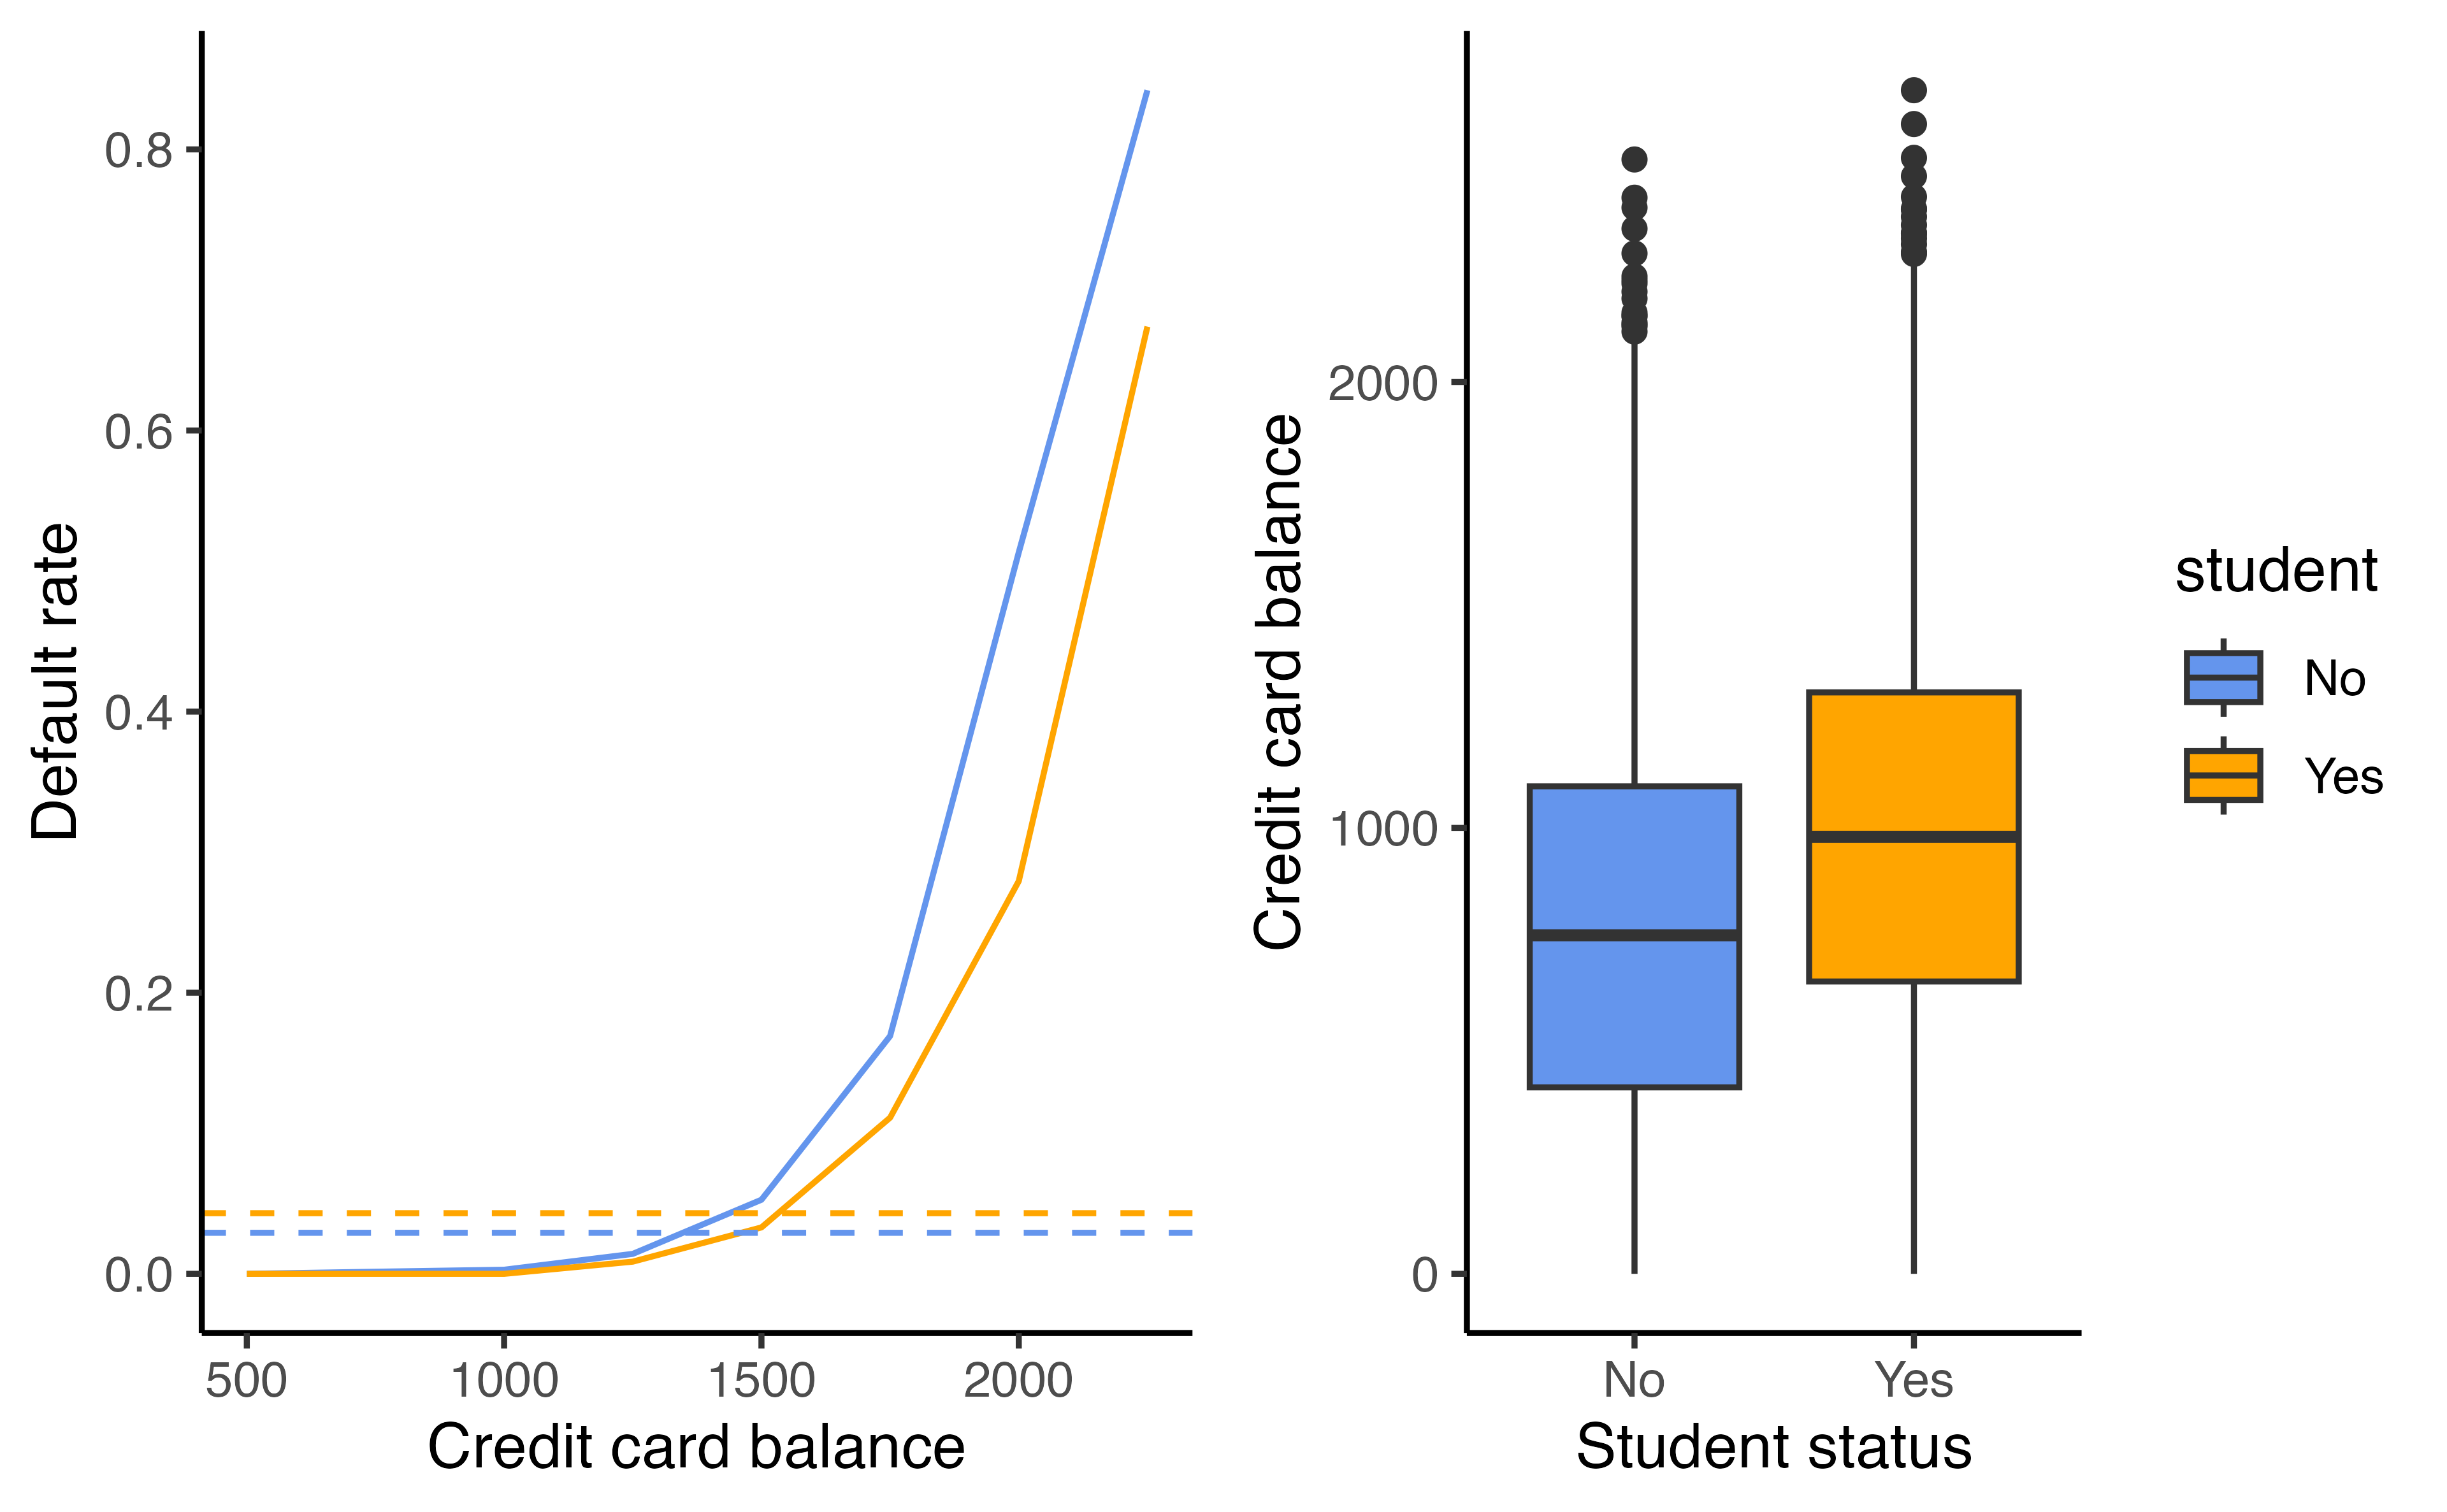
Using the Default data from the ISLR package, fit a logistic regression model predicting whether a customer defaults with whether they are a student and their current balance.