library(MASS)
set.seed(1)

# Generate 5 correlated X variables
Sigma <- matrix(0.25, 5, 5)
diag(Sigma) <- 1
X_mat <- mvrnorm(n = 20, mu = rep(0, 5), Sigma = Sigma)

# Generate Y with known relationship + noise
Y <- 2 + 3*X_mat[,1] - 1.5*X_mat[,2] + 0.5*X_mat[,3] +
    0*X_mat[,4] + 0*X_mat[,5] + rnorm(20, 0, 0.5)

# Create data frame
sim_data <- tibble(
  X1 = X_mat[,1], X2 = X_mat[,2], X3 = X_mat[,3],
  X4 = X_mat[,4], X5 = X_mat[,5], Y = Y
)Exercise 4 – Linear Regression in R
Set up
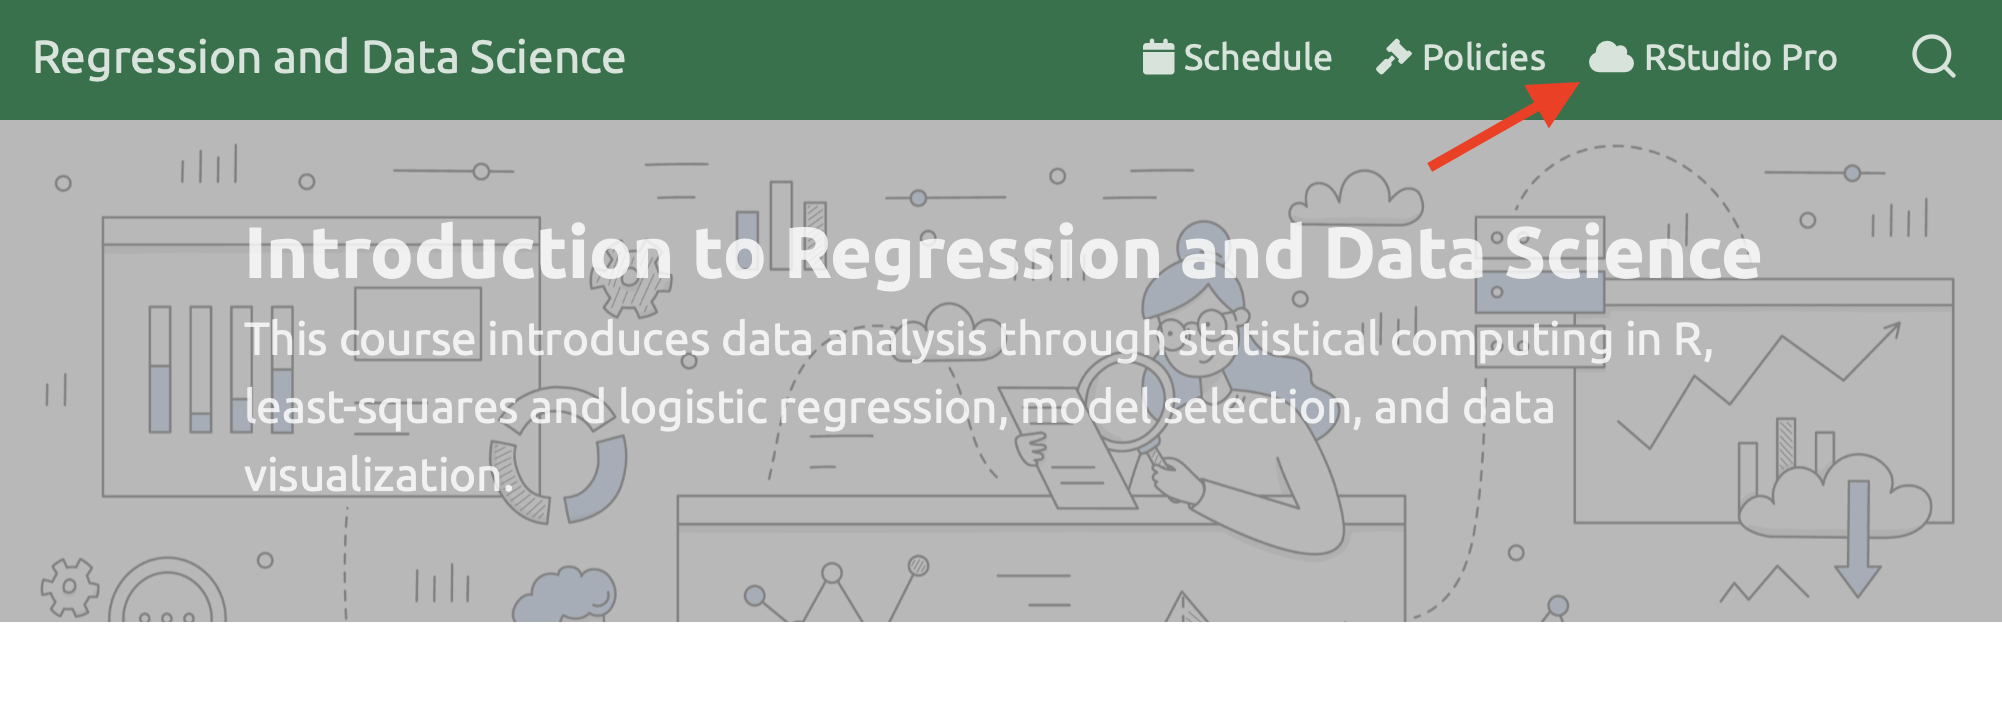
Login to RStudio Pro
- Note: if you are off campus, you will need to use a VPN to connect
- Go to rstudio.deac.wfu.edu
Step 1: Create a New Project
Click File > New Project

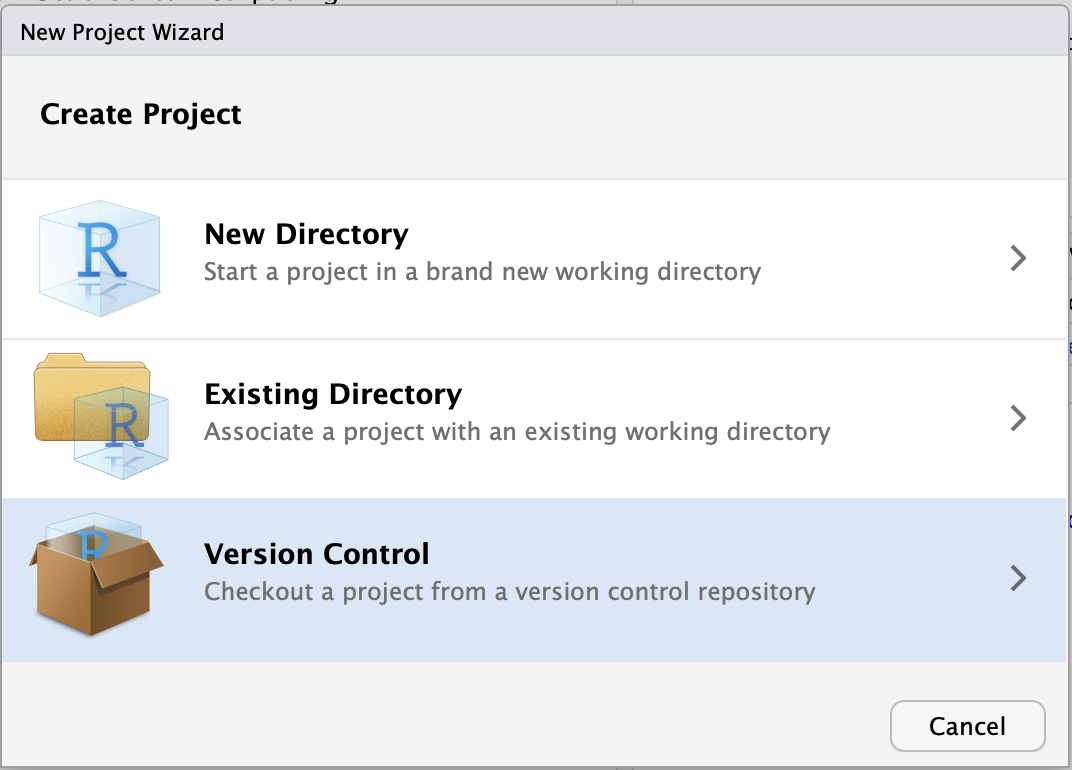
Step 2: Click “Version Control”
Click the third option.
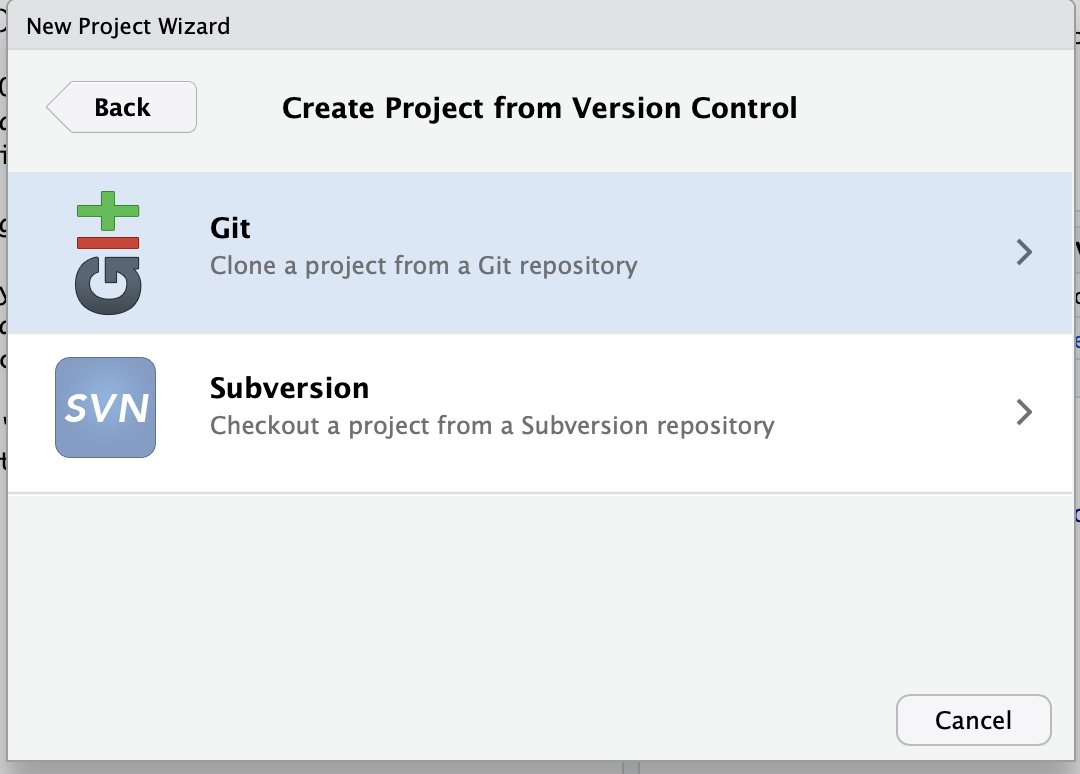
Step 3: Click Git
Click the first option
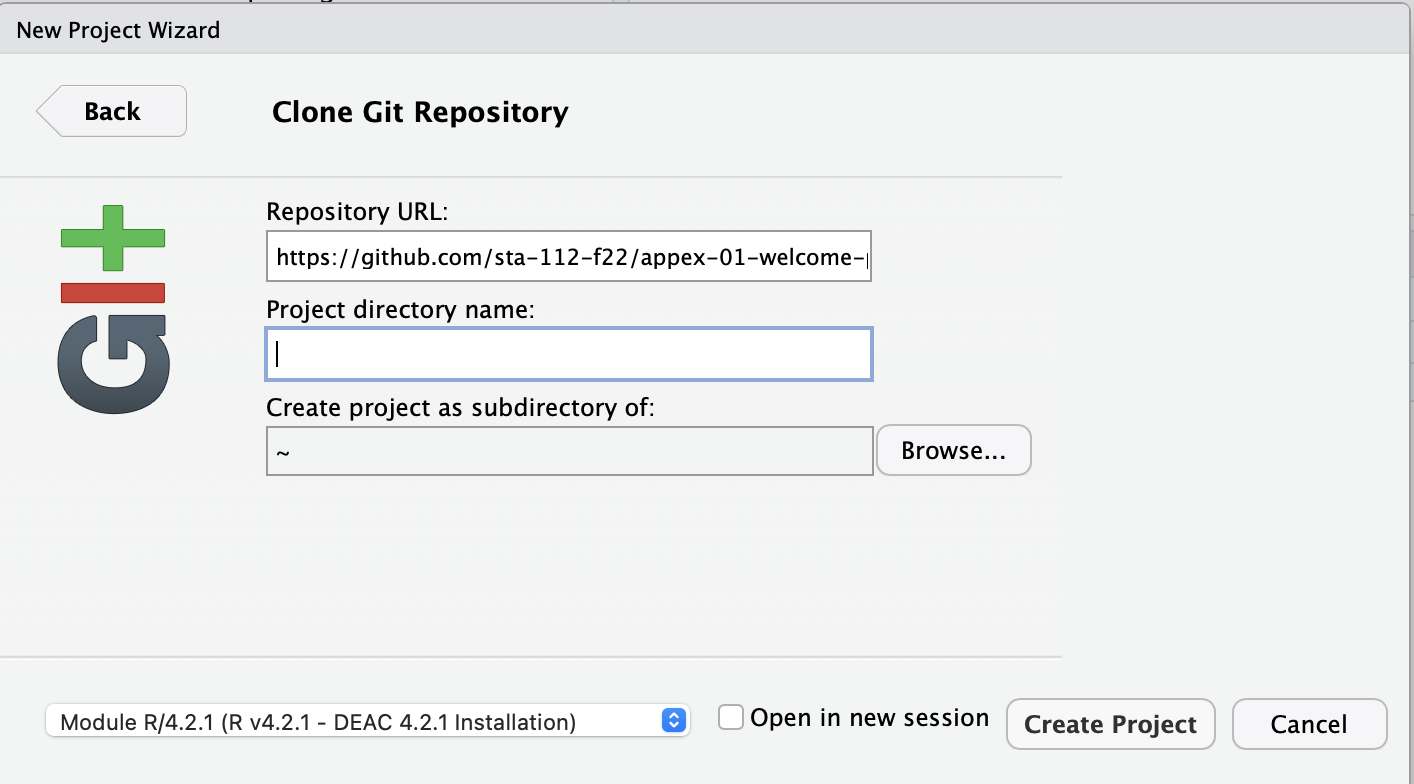
Step 4: Copy my starter files
Paste this link in the top box (Repository url):
https://github.com/sta-363-f25/04-ex.git
Part 1
- Run this code to create a simulated dataset:
- Fit a linear model predicting Y from all 5 X variables using
linear_reg()
- Make predictions for new observations where all X variables = 0, 1, and 2
- Make predictions for all observations in the training data
Part 2
- Using your simulated data, create the design matrix X (including intercept column)
- Calculate the coefficients manually using:
solve(crossprod(X)) %*% t(X) %*% y
- Compare these coefficients to what you got from
linear_reg() |> tidy()
- Try changing the noise standard deviation from 0.5 to 2.0 - how do the predictions change for the training data?
Part 3
- Create three simulations with different noise levels: sd = 0.1, 1.0, 3.0
- For each noise level, make predictions for the training dataset
- Plot the predicted values with prediction intervals
- How do prediction intervals change with noise level?